
Dashy: Free Open Source Dashboard to Organize All Your Services

f you’re self-hosting multiple apps or managing a growing collection of web services, finding and accessing everything quickly can become a chore. That’s where Dashy comes in — a free, open-source dashboard that helps you centralize all your links, tools, and services in one beautiful and customizable interface.
Whether you’re an open-source enthusiast, a sysadmin, or just someone who loves clean organization, Dashy provides a simple, powerful way to bring order to your digital setup.
Watch our dedicated platform overview
Links & Widgets
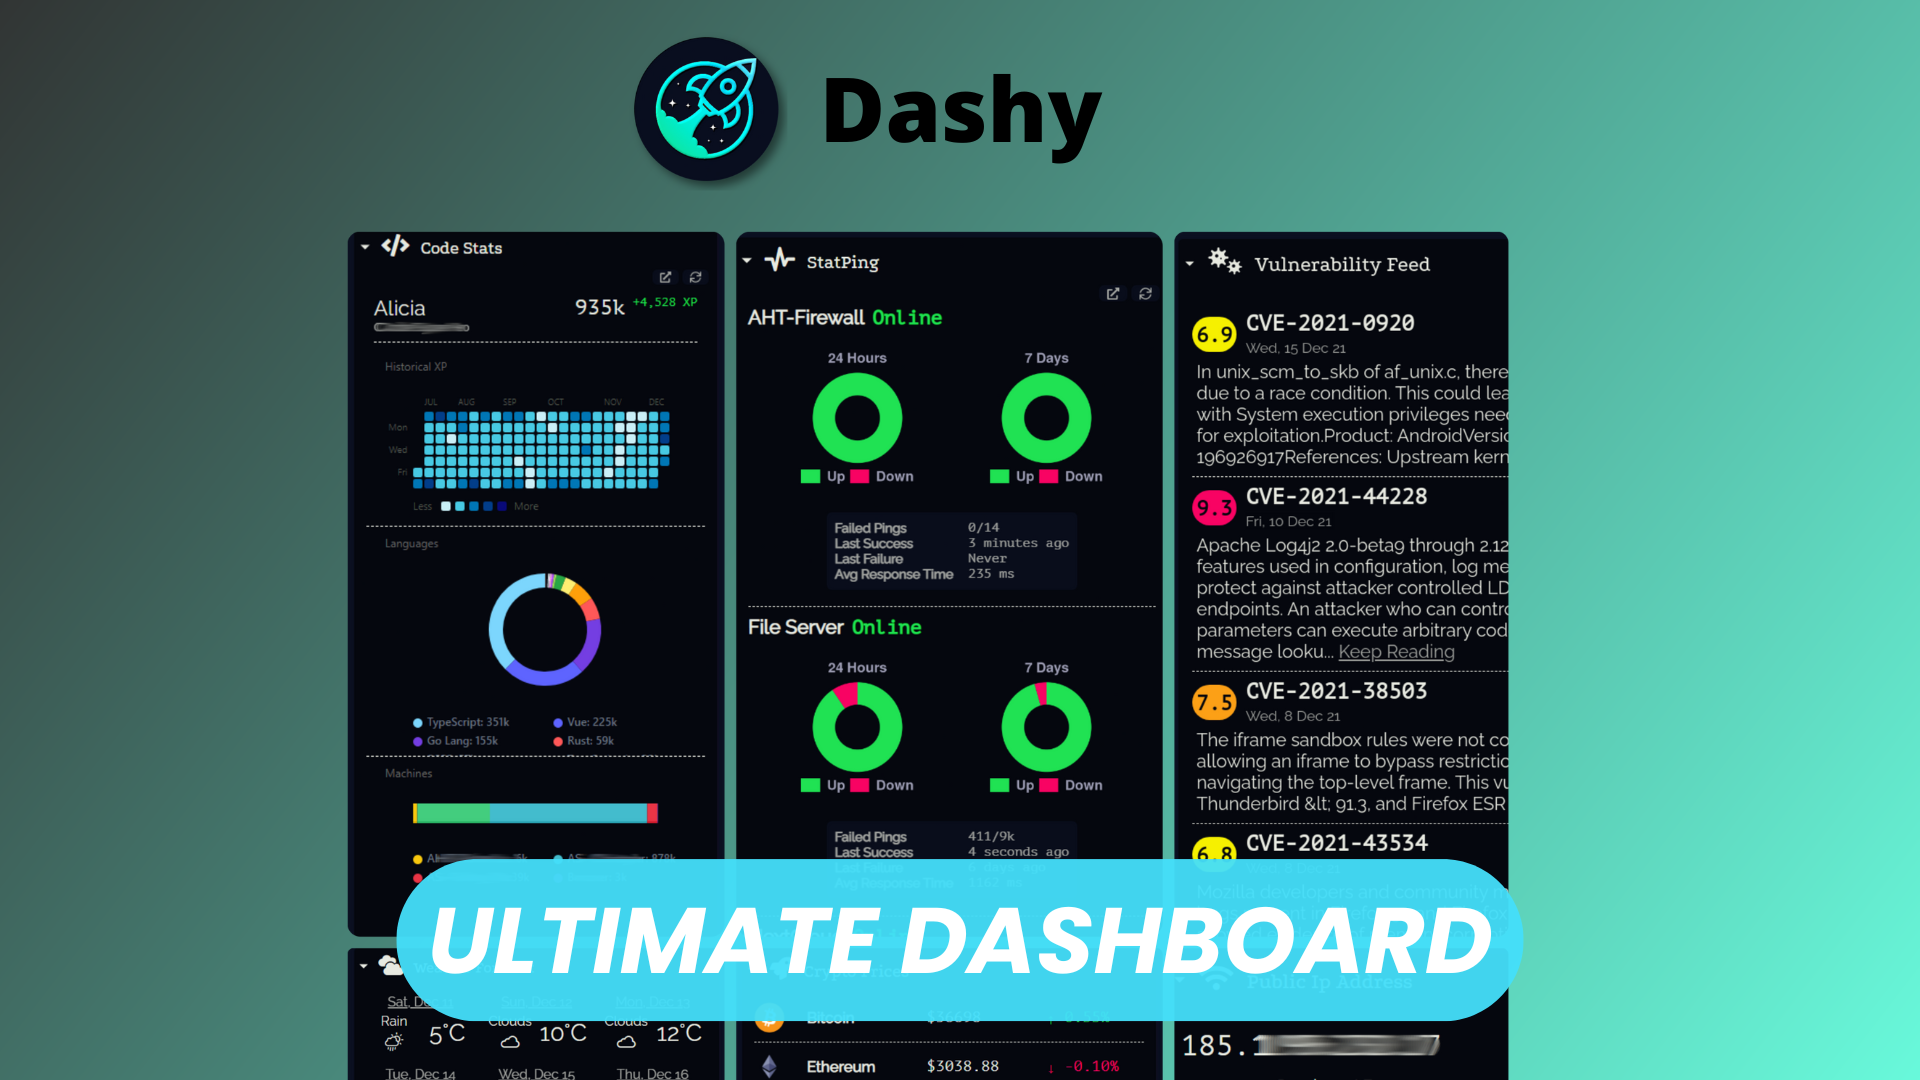
At its core, Dashy is built around links and widgets.
You can group your most-used URLs — like admin panels, media servers, monitoring tools, or documentation — into neat sections. But Dashy goes beyond just being a bookmarks page: it supports interactive widgets that display live information from APIs, system stats, or even weather data.
From simple “click-to-open” shortcuts to dynamic widgets like Docker container health or GitHub repository stats, everything stays visible and interactive on a single dashboard.
Searchbar
Dashy features a built-in search bar that can scan across all your links, allowing you to jump directly to any service in seconds. You can also configure it to query external search engines or documentation sites.
This means whether you’re looking for “Grafana,” “Nextcloud,” or a random config page buried deep in your self-hosted setup — Dashy’s search puts it all just a few keystrokes away.
Themes & Customization
One of Dashy’s biggest strengths is its customization.
You can easily change the entire look and feel of your dashboard with prebuilt themes or by tweaking colors, backgrounds, and fonts. Prefer a dark hacker-style interface? Or maybe something light and minimal? Dashy supports both — and everything in between.
It also supports custom CSS, icons, and layout options so you can personalize the experience to perfectly match your setup or branding.
Config File Editor
Dashy’s configuration is stored in a simple YAML file, which makes it easy to manage and version control.
But for those who prefer a visual approach, Dashy includes a built-in Config Editor — a graphical tool where you can add links, edit sections, switch themes, or modify layout settings right from your browser.
It’s perfect for beginners who want a user-friendly interface and for advanced users who enjoy fine-tuning details.
Users
Dashy also supports basic authentication, allowing you to restrict access to specific dashboards or features.
This is especially useful when you’re hosting internal tools, shared environments, or private services. Multiple users can have their own dashboards and configurations, keeping things organized and secure.
Widgets
Widgets in Dashy make the dashboard come alive.
You can add real-time status indicators, system health metrics, or even custom API integrations. For example, you might track CPU usage on your home server, monitor uptime via a status API, or check the latest commits from a GitHub repository.
With a growing list of community-built widgets, Dashy becomes not just a launchpad — but a living control center for your digital ecosystem.
Conclusion
Dashy is an excellent choice for anyone looking to organize, visualize, and simplify their access to multiple web services.
It’s open-source, actively maintained, and built with flexibility in mind — perfect for home labs, small teams, and enterprise setups alike.
If you’re tired of scattered bookmarks and browser tabs, give Dashy a try — and bring all your tools together in one unified dashboard.