Tracking E-Commerce Sales Performance with Superset
An effective sales performance dashboard can help businesses track their revenue, monitor order value, and assess conversion rates all in one place. Apache Superset provides a platform to create such a dashboard, giving you actionable insights to optimize sales strategies. This guide will show you how to build a real-time e-commerce sales dashboard using Apache Superset. By the end, you will have a system that tracks key metrics like revenue, average order value (AOV), and conversion rates, and allows you to filter data by product category or time period.
Why Build a Sales Dashboard in Superset?
An e-commerce sales dashboard allows you to centralize your sales data from multiple platforms, providing a complete view of your business in real time. Apache Superset can connect to various data sources and provide a highly customizable dashboard experience. The major benefits of using Apache Superset for a real-time sales performance dashboard include:
- Instant Insights: Access to real-time data ensures that you're always up-to-date with how your sales are performing. This allows you to make quick, informed decisions about marketing strategies, adjust ongoing promotions, or manage inventory in response to spikes in demand.
- Data Centralization: By consolidating sales data from various channels—whether it’s Shopify, WooCommerce, or a custom e-commerce platform—into a single dashboard, you eliminate the need for manually compiling reports.
- Custom Visualizations: Creating dynamic and interactive charts in Apache Superset allows you to transform complex datasets into simplified visuals that are easy to interpret. These custom visualizations help stakeholders quickly understand trends and make data-driven decisions.
Connecting Superset to Your E-Commerce Database
The first step to building your sales dashboard is to connect Apache Superset to your sales database. Whether you’re using MySQL, PostgreSQL, ClickHouse, or another database to store sales data, Apache Superset supports various connections.
- Access Database Connection in Superset: In the Superset UI, navigate to the Database Connections under settings.

- Add a New Database: Click + Database > Supported Databases > Other and provide the connection details for your database, such as the SQLAlchemy URI.

- Enter Connection Details: Provide the database credentials, including the SQLAlchemy URI. For example, connecting to a MySQL database would look something like this:
connection+driver://username:password@hostname:port/database_name
- Test the Connection: Verify that Superset is able to pull data from the database. Once the connection is successful, you're ready to move to the next step.
Creating Datasets from Sales Data
Now that Superset is connected to your e-commerce database, it’s time to create datasets from your sales tables. These datasets will serve as the foundation for your visualizations.
- Go to the Datasets Section: In Superset, click on Datasets and then select + Dataset.
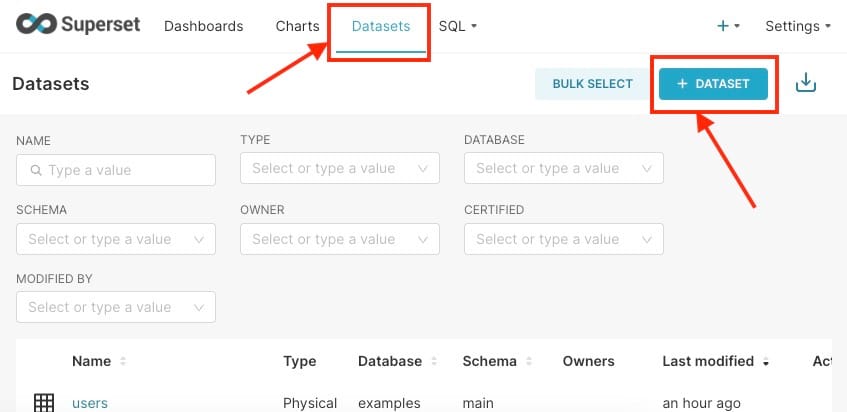
- Select the Relevant Sales Table: Choose the sales data table that contains information such as order transactions, product details, and customer information.
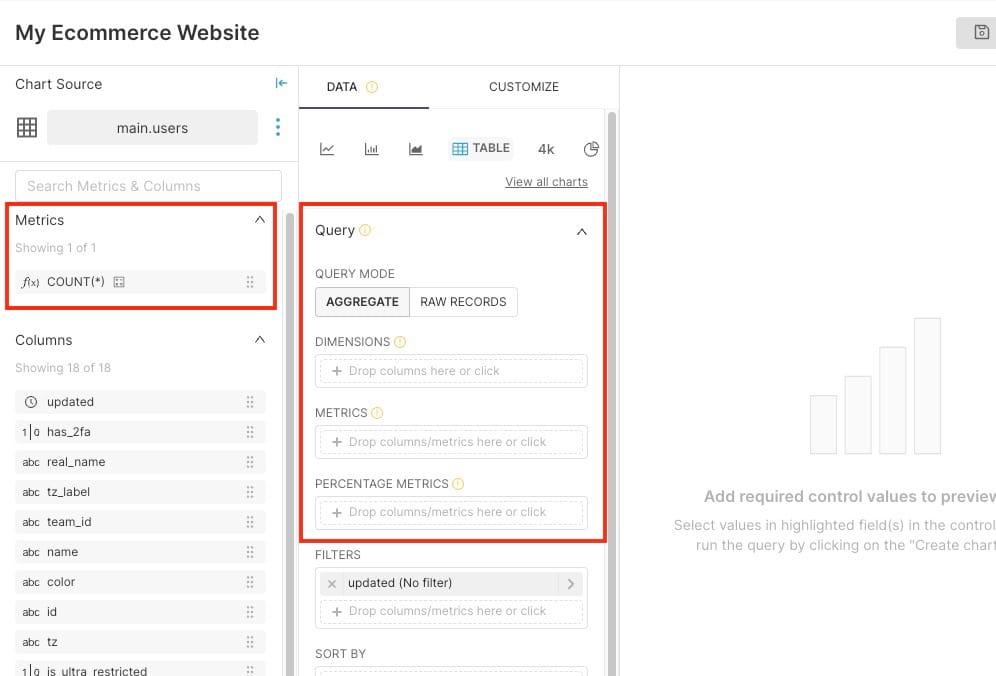
- Define Key Metrics: You’ll need to create metrics like total revenue, number of orders, conversion rate, and average order value (AOV). These will allow you to build meaningful visualizations that track the health of your sales.
- Total Revenue: Sum of all sales transactions during a specific time period.
- Number of Orders: The total number of individual orders placed by customers.
- Conversion Rate: The percentage of visitors who make a purchase on your site.
- Average Order Value (AOV): A calculation of how much customers are spending per order, which helps you understand customer purchasing behaviour.
Building Visualizations for Sales Metrics
Once your datasets are ready, the next step is to create visualizations to display the key metrics of your e-commerce performance. Superset offers a wide array of chart types that are perfect for sales analytics.
- Revenue Over Time (Time Series Chart): A time series chart will allow you to monitor how revenue fluctuates day-to-day, week-to-week, or month-to-month. You can use this chart to identify peaks during sales promotions or dips during slow periods.
- Average Order Value (Bar Chart): A bar chart can be used to visualize the average order value. This gives insight into purchasing patterns and can help identify opportunities for upselling or cross-selling to increase the AOV.
- Conversion Rate (Gauge or Pie Chart): A gauge chart or pie chart can provide a quick visual snapshot of your current conversion rate. Tracking this over time will give you an idea of how effective your website and marketing campaigns are in turning visitors into customers.
- Sales by Product Category (Pie Chart): A pie chart allows you to see which product categories are performing best. This can inform decisions about product promotion, inventory management, or discontinuing underperforming products.
Creating a Real-Time Sales Performance Dashboard
Once you’ve built your key visualizations, the next step is to assemble them into a single, cohesive dashboard.
- Navigate to the Dashboards Section: In Superset, go to Dashboards and click + Dashboard.

- Add Charts to Your Dashboard: Drag and drop your visualizations, including total revenue, AOV, conversion rate, and sales by product category, into the dashboard interface or Create New Chart according to your needs.
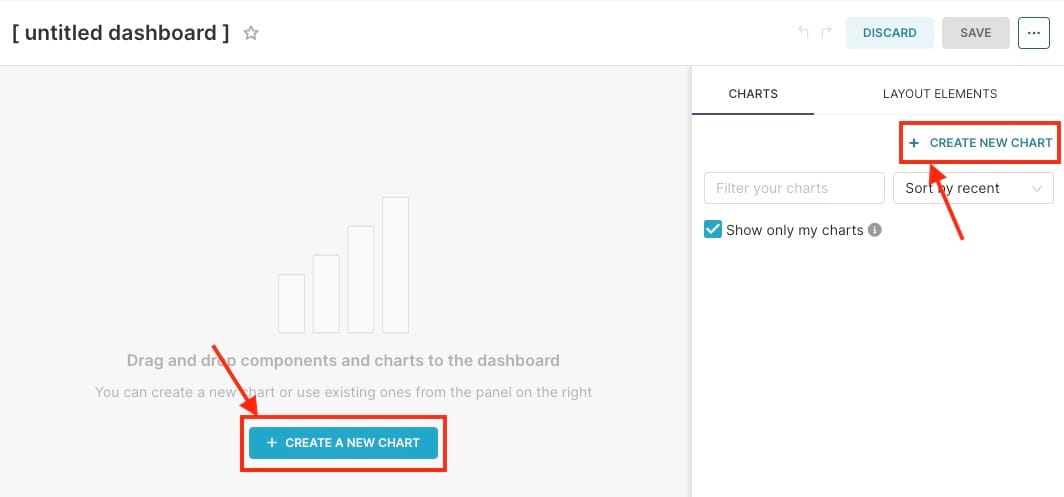
- Customize Layout: You can resize and rearrange charts to create a layout that fits your business needs. Consider placing the most important metrics (like total revenue or AOV) at the top for easy access.
Adding Filters for Dynamic Analysis
To enable more granular analysis, you can add filters to your dashboard. Filters allow users to narrow down the data they’re viewing by criteria such as date range, product category, or geographic region.
- Date Range Filter: The date range filter is crucial for understanding how sales performance evolves over time. By allowing users to specify a custom date range, such as a day, week, month, or even a year, it offers flexibility in how you view your sales data. This helps in spotting seasonal trends, understanding the impact of promotions, or identifying periods of high and low sales activity.
- Product Category Filter: The product category filter allows for more granular analysis by letting you focus on the sales performance of specific categories, such as electronics, clothing, or home goods. By adding a dropdown menu for category selection, users can quickly filter their dashboard to analyze which product lines are performing well or underperforming. This helps in identifying which categories drive the most revenue and which may need promotional efforts, better stock management, or potential discounts.
- Geographic Filter: For businesses that operate in multiple regions, a geographic filter provides valuable insights into how sales performance varies across different locations. By filtering data by country, state, or even city, you can identify geographic trends, such as regions with the highest sales, markets that are expanding, or areas that may need more attention in terms of marketing or promotions. This information can guide regional marketing strategies, help allocate resources, and ensure that inventory levels are optimized for specific markets.
Key Metrics to Track in Your Sales Dashboard
A successful sales performance dashboard tracks essential KPIs that reflect your business’s overall health. Here are a few critical metrics you should be tracking:
- Total Revenue: The most important metric for any e-commerce business, showing how much revenue has been generated over a given period.
- Conversion Rate: This tells you what percentage of visitors are converting into paying customers. Monitoring this metric helps you gauge the effectiveness of your sales funnel.
- Average Order Value (AOV): A higher AOV indicates that customers are purchasing more expensive items or larger quantities, making it a useful metric for measuring the success of upselling and cross-selling efforts.
- Product Category Sales: Understanding which product categories generate the most revenue can help guide your inventory decisions and promotional efforts.
Monitoring Real-Time Data with Alerts
Superset also allows you to set up alerts for critical sales metrics. For example, if your conversion rate drops below a certain threshold or your daily revenue exceeds a set target, you can receive an alert via email or webhook.
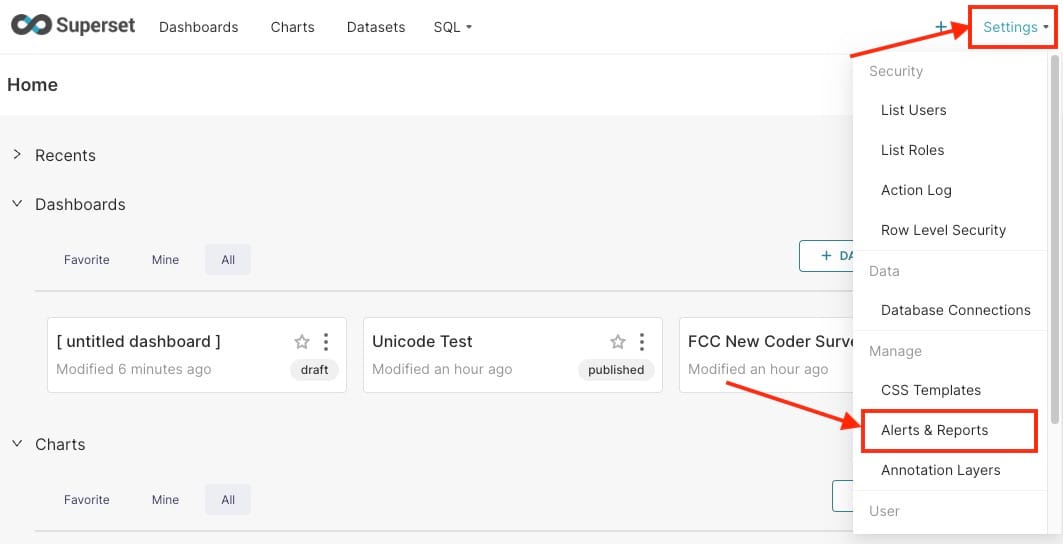
- To set up an alert system, head over to Settings > Alerts & Reports from the top right-hand corner.
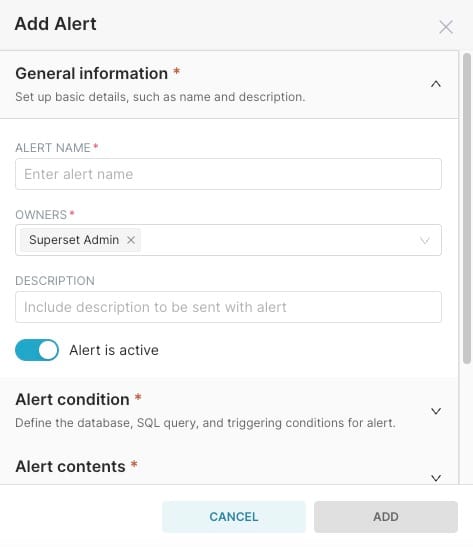
- Next, click on + Alert and fill out the alert information like Alert Name, Owners, Conditions, Contents, etc click on Add once you are done.
Thanks for reading ❤️
By integrating your sales data, setting up custom visualizations, and enabling filters, you can create a dashboard that gives you a clear view of your business's performance. Thank you so much for reading and do check out the Elestio resources and Official Superset documentation to learn more about Superset. You can click the button below to create your service on Elestio. See you in the next one👋
